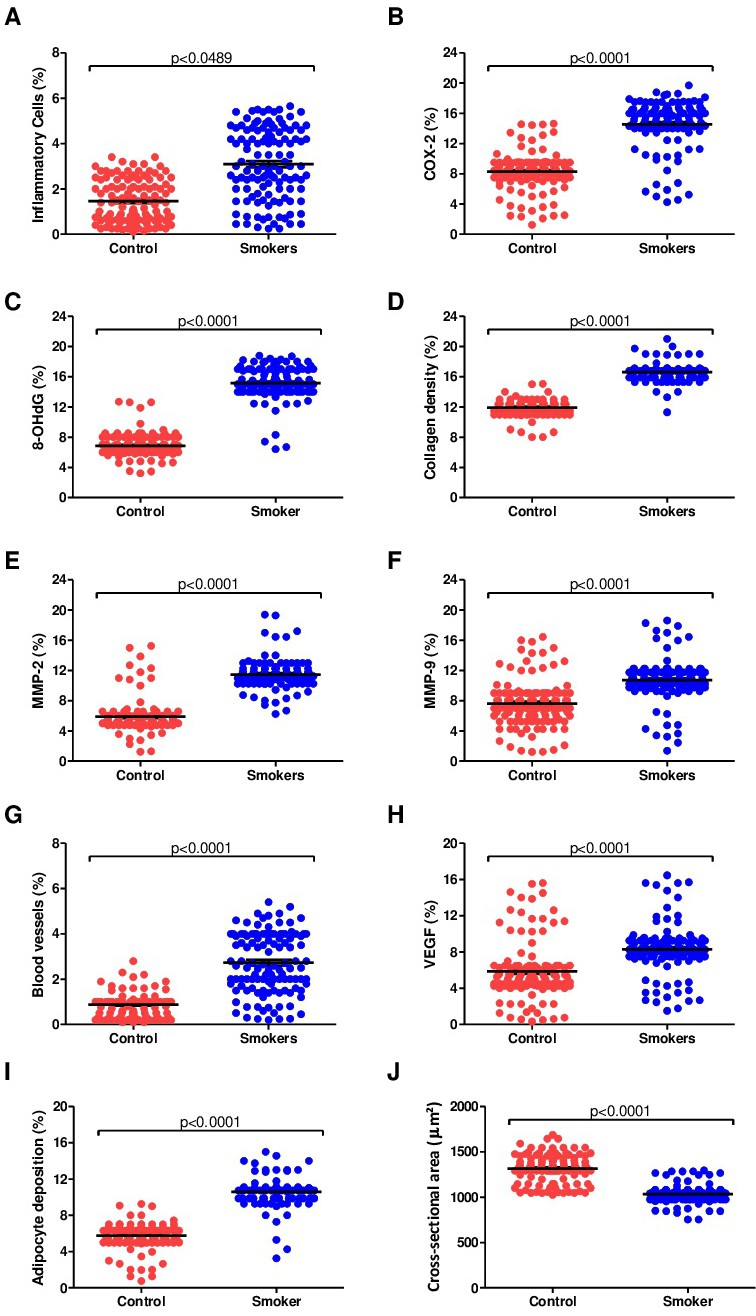
Fig. 3. Representative graphics for the quantitative analysis between the control and smoker groups. Scatter dot plot (each dot represents one field) showing the percentage (points that touched the studied structure divided by the total of points = percentage of the structure) of (A) inflammatory cells; (B) COX-2; (C) 8-OHdG; (D) collagen fibers; (E) MMP-2; (F) MMP-9; (G) blood vessels; (H) VEGF; and (I) adipocyte deposition. The total cross-sectional area (J) between the groups (each dot represents one fiber). Data are mean ± SEM values.